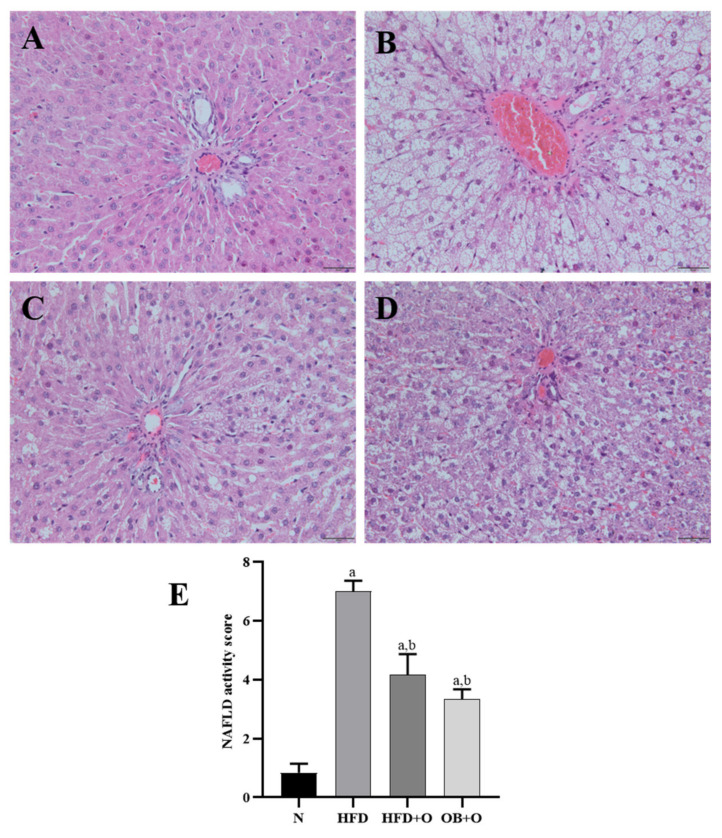
Figure 7.
(A–E). Photomicrographs of the liver using hematoxylin and eosin staining. N, normal control; HFD, high-fat diet; HFD + O, high-fat diet + orlistat 10 mg/kg/day (protective model); OB + O, obese+orlistat 10 mg/kg/day (therapeutic model). (A) The N group shows normal liver architecture. (B) The HFD group shows severe hepatic steatosis and marked inflammatory cells around the portal triad. (C,D) The HFD + O and OB + O groups show reduction of fat deposition and inflammation. (H&E, magnification, ×400). (E) NAFLD activity score in all groups. Data are expressed as mean ± SEM, n = 6/group. One-way ANOVA, followed by Tukey post-hoc test. a p < 0.05 vs. Normal group, b p < 0.05 vs. HFD group.

