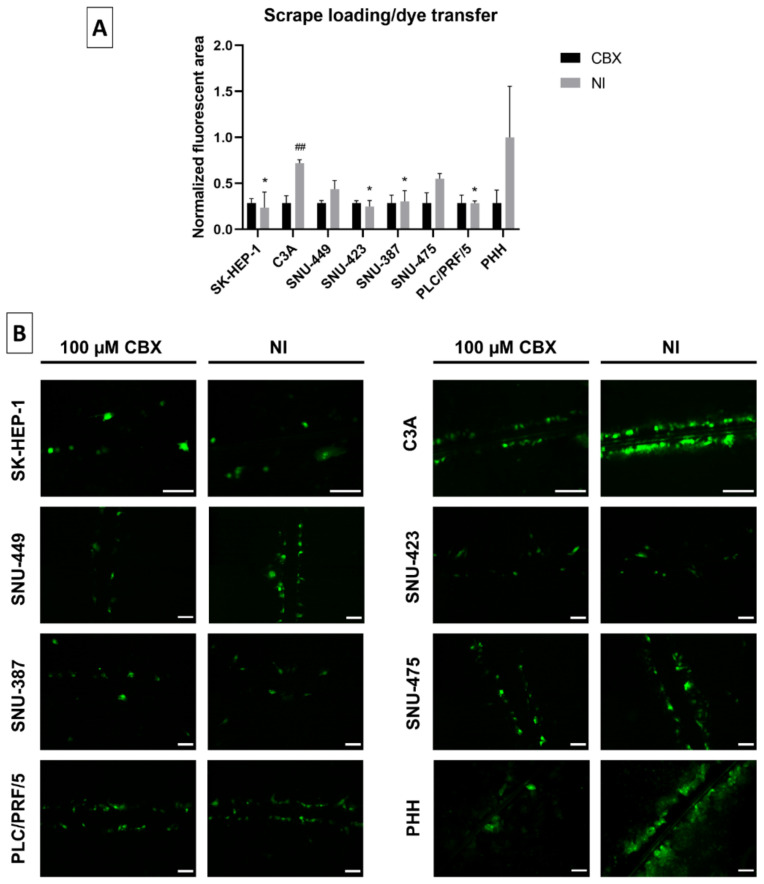
Figure 7.
Gap junctional intercellular communication (GJIC) in liver cancer cell lines. All cell lines (n = 1–2, N = 1 (multiple images per well)) were grown to 100% confluence when a scrape was made across the well in presence of Lucifer Yellow (LY). Cells were washed and subjected to fluorescence microscopy analysis. Images were taken with a 10× or 20× objective (B). GJIC was either not inhibited (NI) or inhibited by 100 µM carbenoxolone disodium salt (CBX) for 10 min. The fluorescent area was measured with ImageJ. Data were normalized to the inhibited control and expressed as a ratio to the mean NI fluorescent area of primary human hepatocytes (PHH). Data are expressed as mean ± standard deviation (A). Significant differences compared to NI PHH are indicated with * p ≤ 0.05, while differences to the respective CBX control are indicated with ## p ≤ 0.01. Scale bar = 100 µm.

