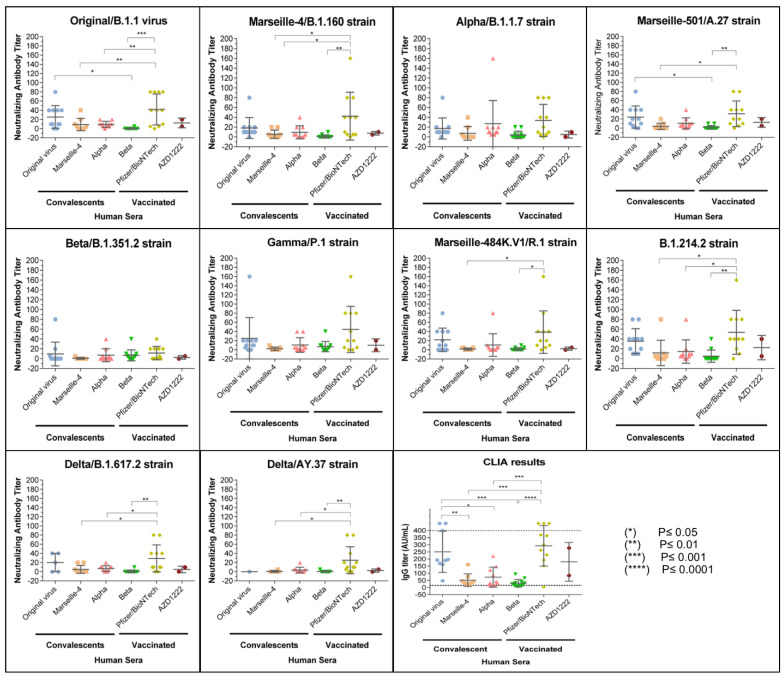
Figure 1.
Figure showing the neutralising response against the original virus (Original/B.1.1) and the 9 SARS-CoV-2 variants in convalescent patients and in vaccinated participants. The Y-axis represents the neutralising antibody titres obtained by MNT, and the X-axis represents the corresponding group of tested human sera. Data are shown as the mean and standard error of the mean (SEM). Solid lines represent the geometric mean titre, and the whiskers show the 95% confidence interval. Each scatter represents one serum. Scatter symbols and colours are attributed on the basis of the sera group. Serology results are shown for the convalescent patients and for the vaccinated patients. For seroneutralisation, the 10 quadrants correspond to one different tested strain each. The last quadrant shows the IgG titres in AU/mL as obtained by chemiluminescent immunoassay (CLIA) for each serum group. IgG titres > 400 are represented in the graph above the maximum threshold of detection (400 AU/mL). The same statistical significance was obtained by excluding these nonquantitative values (>400) from the ANOVA test. In all graphs, significance is represented by an asterisk for p ≤ 0.05. The absence of an asterisk means no significant variance was detected between the groups.

