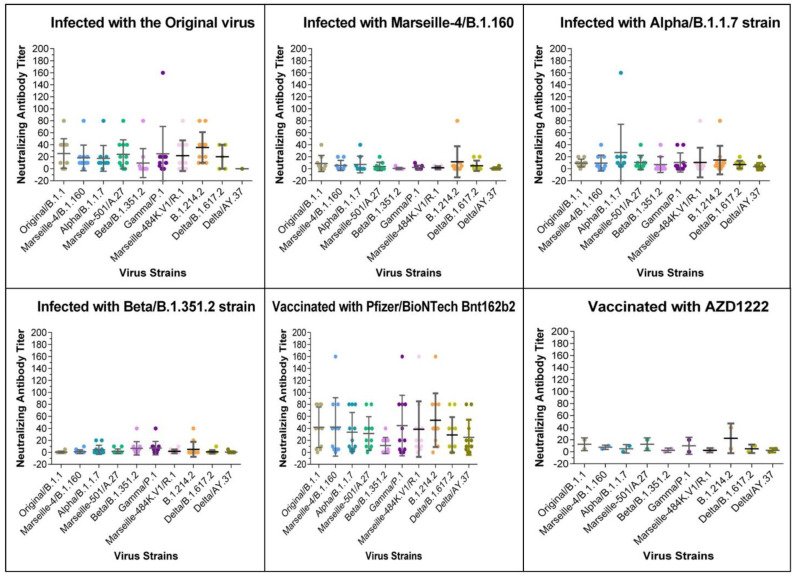
Figure 2.
Figure showing the neutralising response of each serum group against the original virus (Original/B.1.1) and the 9 SARS-CoV-2 variants in convalescent patients and in vaccinated participants. The Y-axis represents the neutralising antibody titres obtained by MNT, and the X-axis consists of the different tested SARS-CoV-2 strains. Data are shown as the mean and standard error of the mean (SEM). Solid lines represent the geometric mean titre, and the whiskers show the 95% confidence interval. Each scatter represents one serum. Scatter’s symbols and colours are strain-specific. Each quadrant in the figure corresponds to one different sera group. In all graphs, significance is represented by an asterisk for p ≤ 0.05. Significance is represented as an asterisk for significant p-values. The absence of an asterisk means no significant variance was detected between groups.

