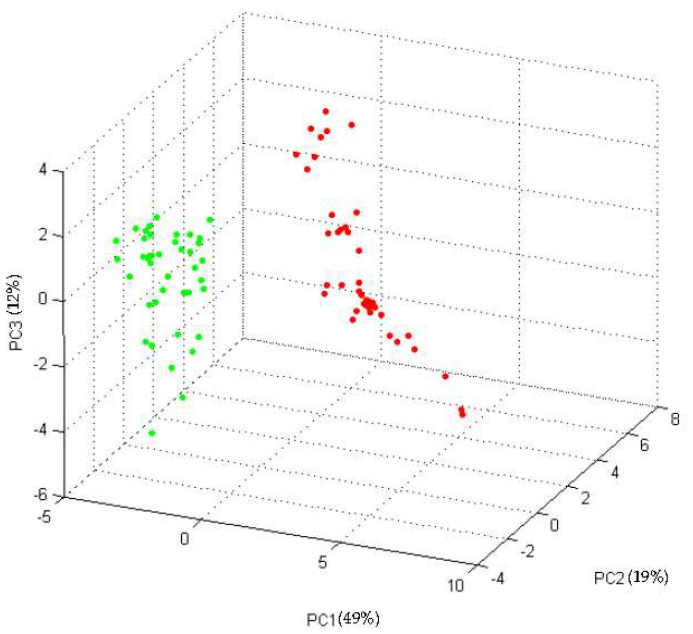
Figure 1.
Three-dimensional plot of the spectra of the “training set” strains obtained by Principal Component Analysis (PCA) (dots of the same colour represent replicates of strains of the same class: colR-Ec strains in red and colS-Ec strains in green). For each principal component (PC), the percentage of the “explained variance” is reported in round bracket.

