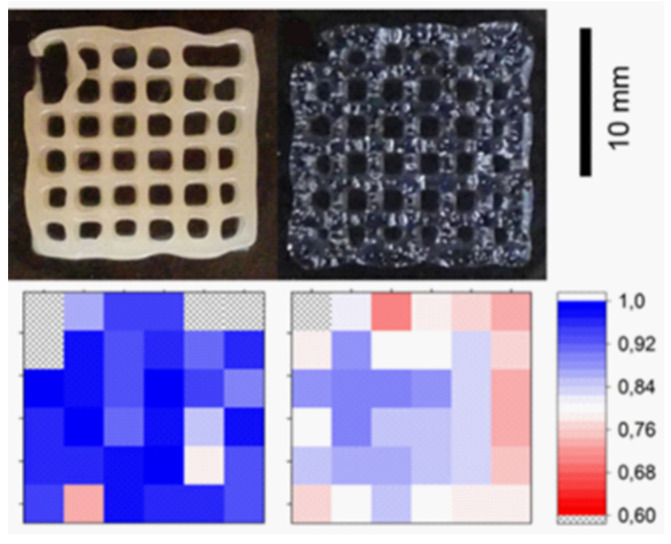
Figure 11.
Shape fidelity of the printed PEGDA lattices using HT (left) and LAP (right) as rheological additives. The bottom row shows the shape fidelity of the comparison with the desired structure, graded with a color code. Blue shades depict a high accuracy or printing; Red indicates low conformity. Areas with printing errors are marked with “x”. Reproduced with permission from [81], Wiley Online Library, 2018.

