Figure 2.
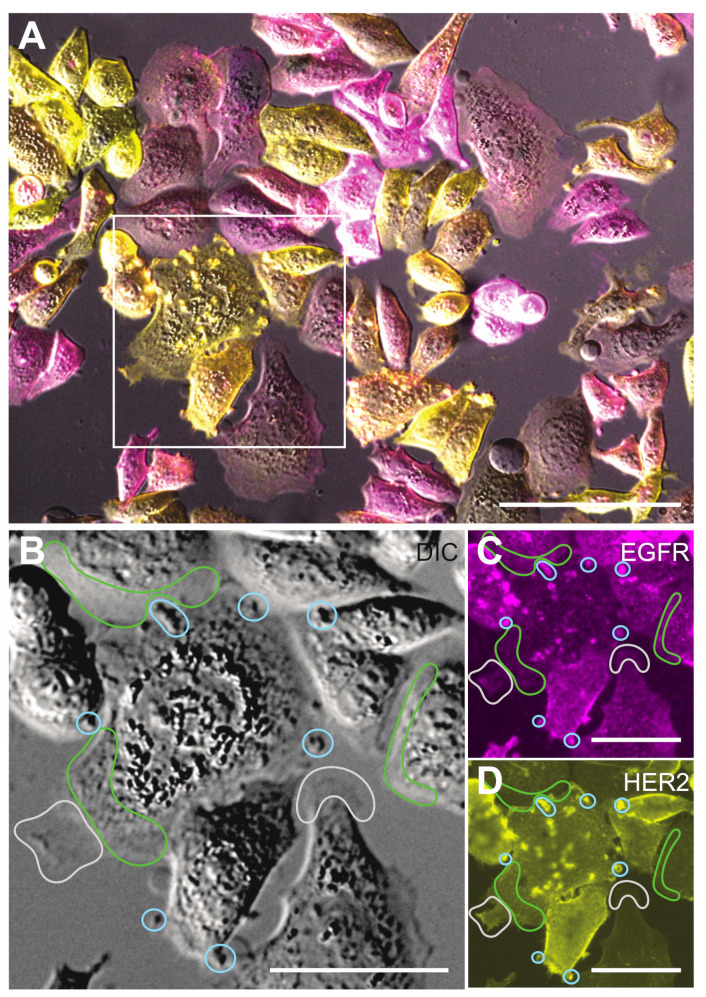
Light microscopy (LM) of SKBR3 cells dual-labeled for EGFR- and HER2. (A) LM overlay image from the differential interference contrast (DIC)-, and the fluorescence signals of the EGFR-QD655 label (magenta), and the HER2-QD565 label (yellow). The QD655 channel was adjusted in a more sensitive manner than the QD565 channel to compensate for the lower ρR of EGFR compared to HER2. The cells in the marked square display an increased concentration of both receptors in delimited areas (bright spots) of the plasma membrane. (B) DIC-image detail of the boxed area in (A), with marked examples of three functionally different regions of the plasma membrane, being large plasma membrane protrusions (LMPs), enclosed by blue lines, lamellipodia, which are flat and slowly oscillating protrusions at the rim of a cell, marked by grey lines, and the areas without a special structure in the LM images, classified as fine-structured membrane (FSM) areas, were delimited by green lines. (C) Same region as in (B), but then for the fluorescence signal from QD655-labeled EGFR, which is particularly bright in LMP. (D) Same region as in (B), fluorescence signal of QD565-labeled HER2. The similarity of the bright spots in (C,D) indicates a correlated distribution of both receptors in LMPs. Scale bars: 100 µm in (A), 50 µm in (B–D).

