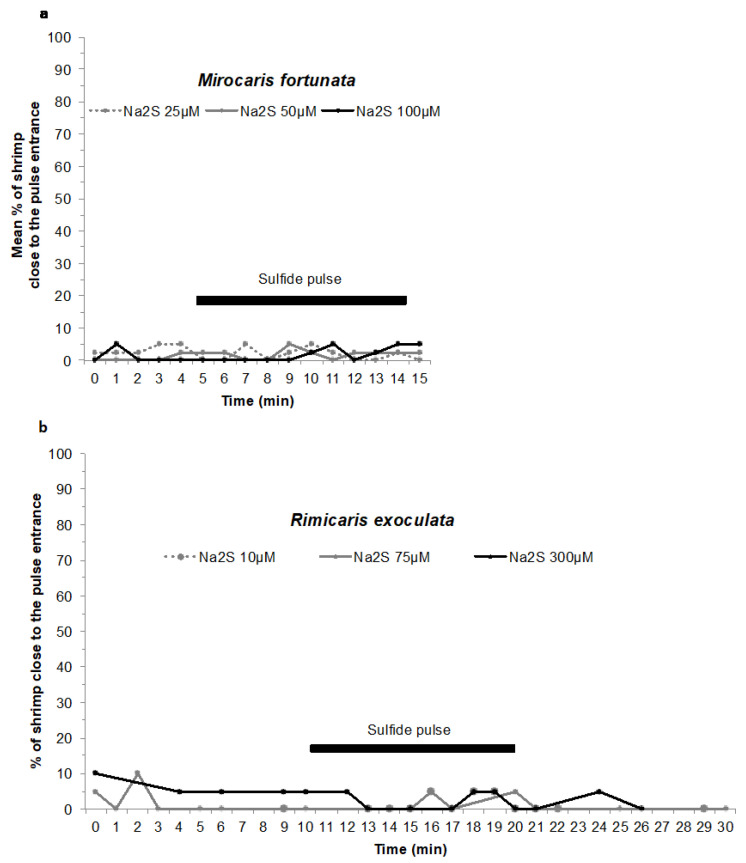
Figure 9.
Responses to sulfide pulse stimuli at in situ pressure on a batch of Mirocaris fortunata and Rimicaris exoculata. (a) Mirocaris fortunata. Mean % of shrimp over an area of 6-cm2 surface around the seawater inlet hole. Three injections were carried out with increasing concentrations of sulfide solutions (25, 50 and 100 µM), and these sulfide pulses are indicated by a black bar along the time scale. One-hour interval separates each sulfide pulse. The experiment was conducted twice on the same batch (n = 20) of shrimp (i.e., each point represents the mean of two replicates). The experimental setup is depicted in Figure 4c, with the following modifications: removal of the HE2, the two temperature loggers and the diffuser plastic cap; (b) Rimicaris exoculata. % of shrimp in contact with the diffuser. Three injections were carried out once on the same batch of shrimp (n = 20), with increasing concentrations of sulfide solutions (10, 75 and 300 µM). The number of shrimp close to the pulse entrance was 0 for the experiment with 10 µM Na2S, and thus the result line is merged with the x-axis. A black bar along the time scale indicates these sulfide pulses. One-hour interval separates each sulfide pulse. The experimental setup is depicted in Figure 4c, with the following modifications: removal of the HE2 and the two temperature loggers.

