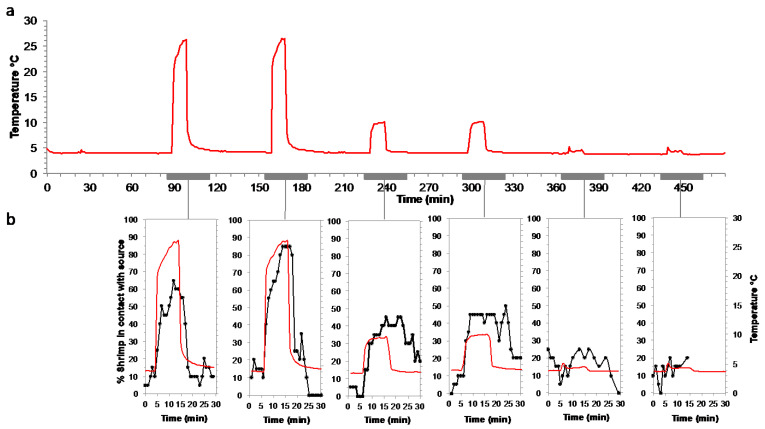
Figure 12.
Responses to warm-temperature pulses at in situ pressure on a batch of Rimicaris exoculata. (a) Profile of warm temperature pulses. The baseline temperature was set at 4 °C, the first two pulses were set at 25 °C, the next two pulses at 10 °C and the last two pulses at 5 °C, with one hour between each pulse; (b) percentage of shrimp (n = 20) in contact with the diffuser for each pulse. The temperature profile is plotted for each 30 min observation period (symbolized by a grey bar on the temperature profile in (a)). For the last temperature pulse, observations after 15 min are missing due to the poor quality of the video (camera field of view obstructed by shrimp and low light).

