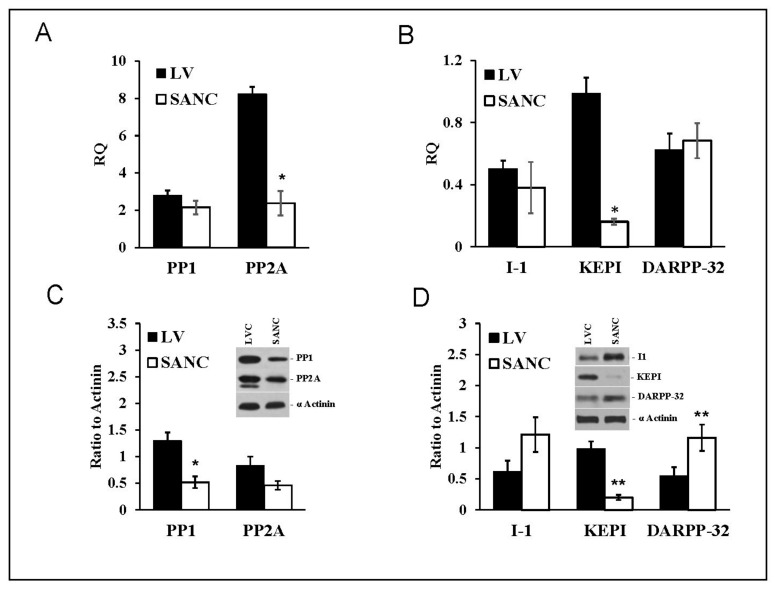
Figure 2.
mRNA expression (A,B) and protein abundance (C,D) (Mean+/−SEM) patterns of PP1, PP2A, and PP1 endogenous inhibitors (I-1, KEPI and DARPP-32) normalized to β-tubulin (mRNA) or α-actinin in LVC and SANC (n = 6 independent hearts analyzed per group); * p < 0.05, ** p < 0.01 compared to LVC. For alternative transcript names see Table S1. For Primers and probes used for RT-QPCR see Table S2.

