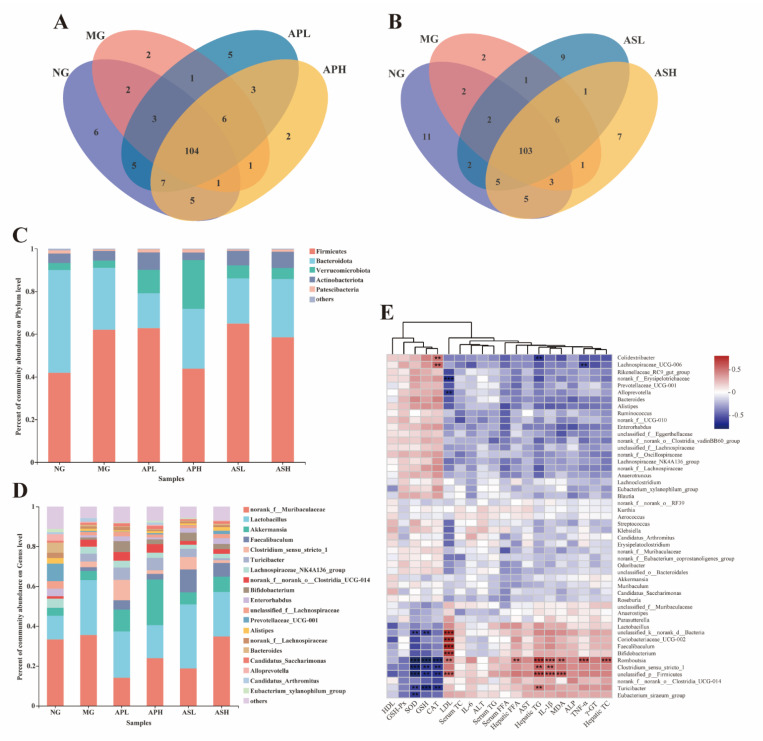
Figure 8.
Effects of AP and AS on the changes of the colonic microbiota composition in ALD mice. (A) Venn diagrams of AP; (B) Venn diagrams of AS; (C) percent of community abundance at phylum level; (D) percent of community abundance at genus level; (E) heatmap of Spearman’s correlation analysis of the biological parameters and relative abundance of colonic microbiota at species level. *** p ≤ 0.001, ** p ≤ 0.01.

