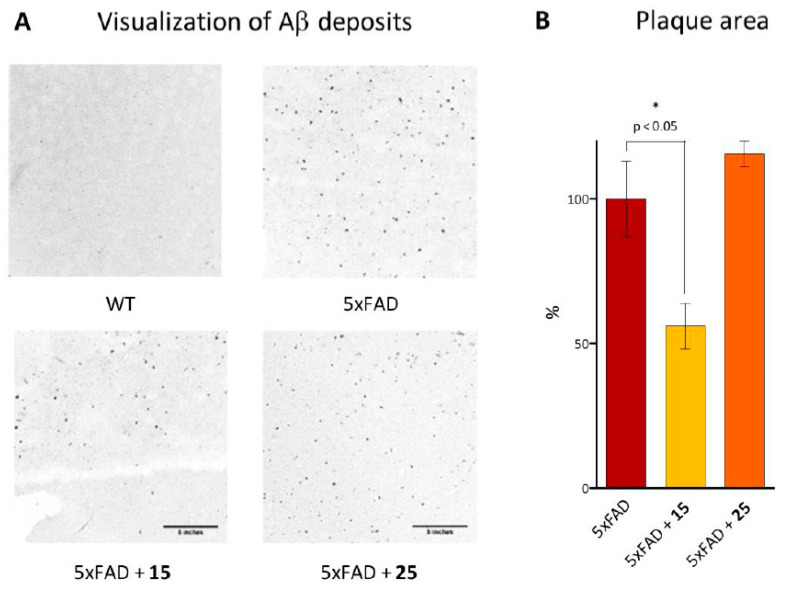
Figure 13.
Ex vivo analysis of the plaque area in the brains of transgenic mice post-mortem pretreated with hydroxamic acids 15 and 25 after in vivo experiments. (A)—photomicrographs of mice brain sections labeled with Congo red to visualize Aβ deposits (scale bar is 5 inches). (B)—percentage of area covered by plaques in the mice brain sections relative to 5xFAD mice taken as 100%. Data are shown as mean ± SEM. *, p < 0.05 versus 5xFAD mice.

