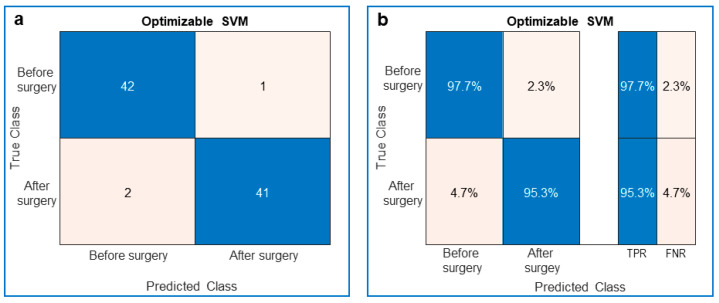
Figure 3.
Performance of the trained optimizable support vector machine (SVM) classifier. (a) Confusion matrix showing the true and predicted classes of the ToF patients’ videos. The blue diagonal is related to the number of videos that were truly recognized (Predicted Class = True Class), whereas the pink antidiagonal is related to the number of videos that were falsely recognized (Predicted Class ≠ True Class). (b) Same as (a) the True Positive Rate (TPR) in blue and the False Negative Rate (FNR) in pink.

