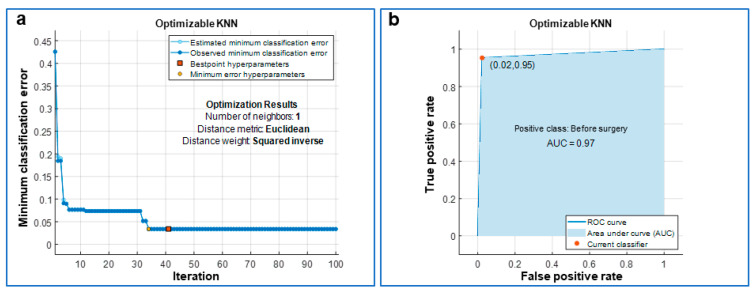
Figure 4.
Optimization of the k-nearest neighbor (KNN) classifier. (a) The classifier was optimized over 100 iterations via the minimization of the classification error and its optimized hyperparameters are reported as “Optimization Results”. In detail, for each iteration of the optimization, the classifier was also 10-fold cross-validated. (b) Receiver Operating Characteristic (ROC) curve with the area under the curve (AUC) painted in blue; a value of AUC close to 1 means a very low classification error for the optimized classifier.

