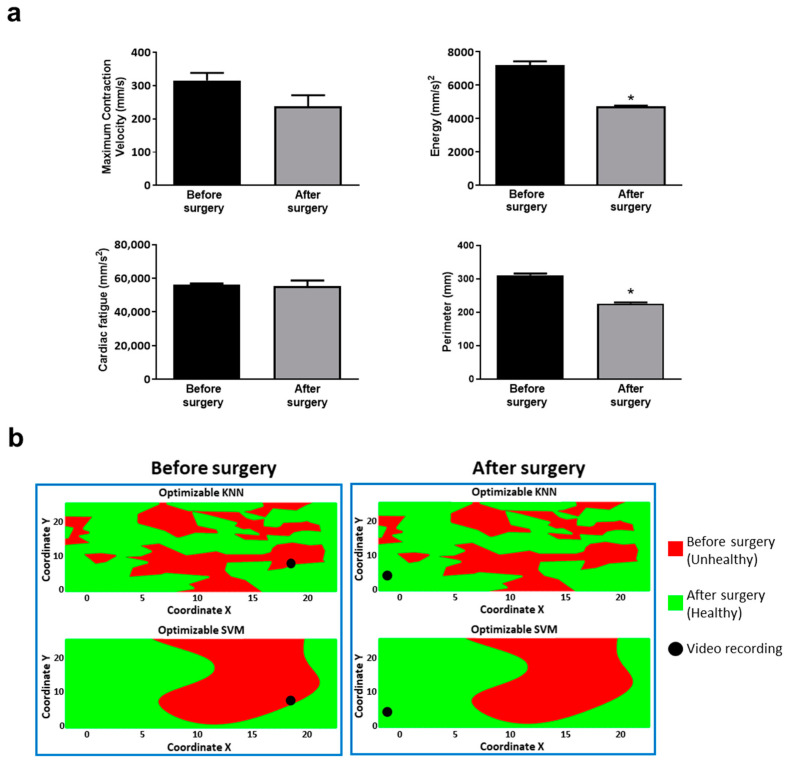
Figure 6.
Vi.Ki.E. data and decision surfaces of a ToF patient with a favorable outcome. (a) The average Vi.Ki.E. parameters calculated before (black) and after surgery (grey). Top left: Maximum contraction velocity. Top right: energy. Bottom left: force. Bottom right: perimeter. Data are shown as mean ± SEM. * p < 0.05 versus before surgery. (b) The decision surfaces of the signal-to-noise ratio (SNR) for both our classification models before (left panels) and after surgery (right panels). The black circle represents the classification/prediction of the patient’s video according to KNN (top) and SVM (bottom) models. The red area is related to a prediction of unhealthy, whereas the green area to a prediction of healthy.

