Figure 6.

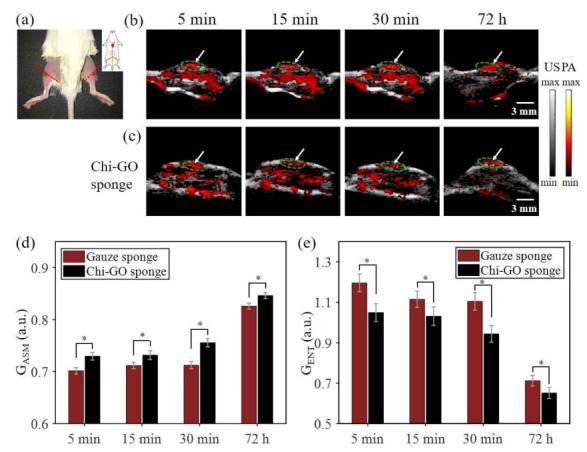
In vivo PAT assessment results. (a) Picture of mouse hemorrhage model. US/PA images of bleeding site from gauze sponge (b) and Chi-GO sponge (c) at the labeled time points. The statistic analysis of GASM (d) and GENT (e) of the GLCM, which are shown as mean ± SD (n = 5), (*) p < 0.01.
