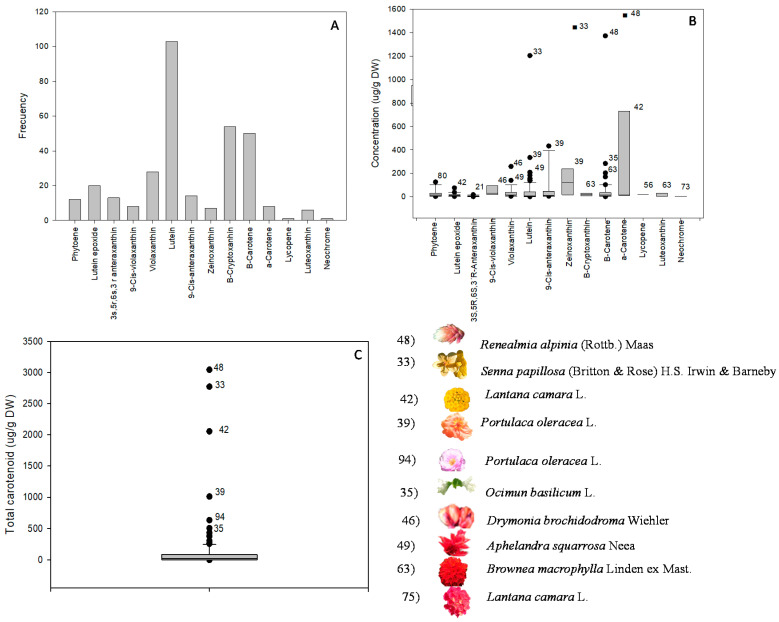
Figure 3.
Frequency, mean contents, and standard deviations of carotenoids and major sources. Frequency (A), mean contents of individual carotenoids (B), total carotenoid content (C), and list of species with high concentrations of carotenoids. Number within the figures represent the sample under study.

