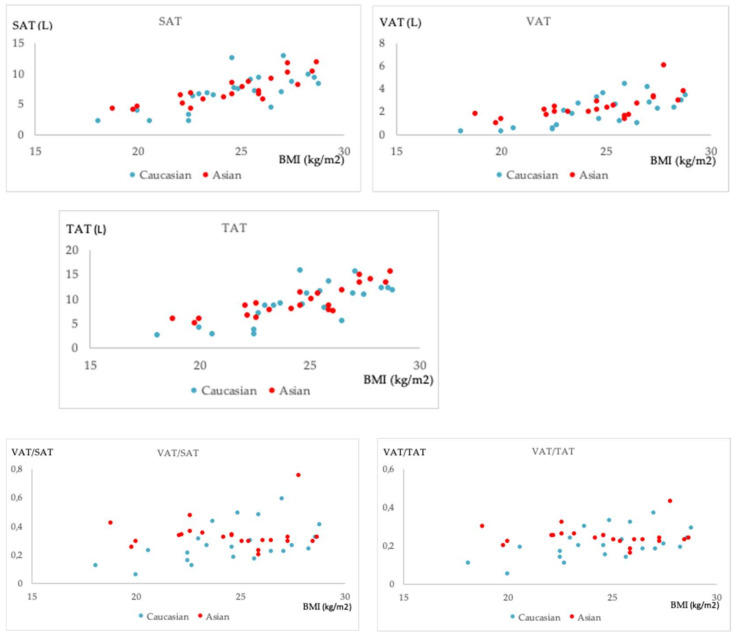
Figure 4.
Scatter plots illustrating the relationships of fat measurements with BMI: SAT and VAT (top row: left to right), TAT (middle row) and VAT/SAT and VAT/TAT (bottom row: left to right) for the Caucasian (blue) and the Asian (red) group. Abbreviations: BMI: Body mass index; SAT: Subcutaneous adipose tissue; TAT: Total adipose tissue; VAT: Visceral adipose tissue.

