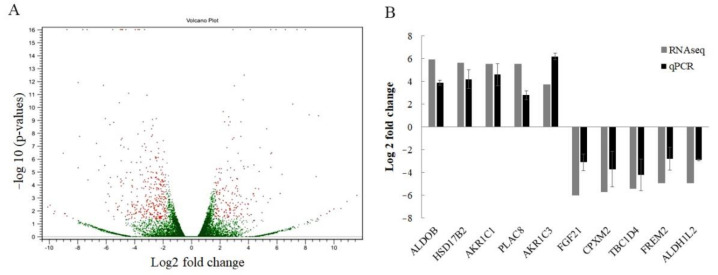
Figure 2.
Identification of differentially expressed genes between KATOIII and KATO/DDP cells. (A) Volcano diagram of differentially expressed genes between KATO/DDP and KATOIII cell lines, showing 174 upregulated and 345 downregulated genes. (B) To validate the differentially expressed genes from RNA sequencing, the expression level of five upregulated and downregulated genes were examined by using qPCR.

