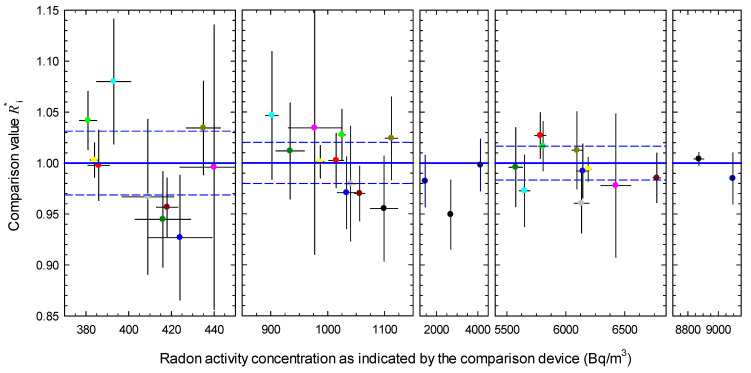
Figure 2.
Comparison values given as modified ratios () and attributed uncertainties; blue straight lines represent a common mean of 1, dashed blue lines cover the standard variation interval (coverage factor ) according to Table 5, error bars indicate the standard uncertainties of the reported values, the results of the same participant are indicated by the same color and the color assigned to the respective participant is the same as in Figure 1.

