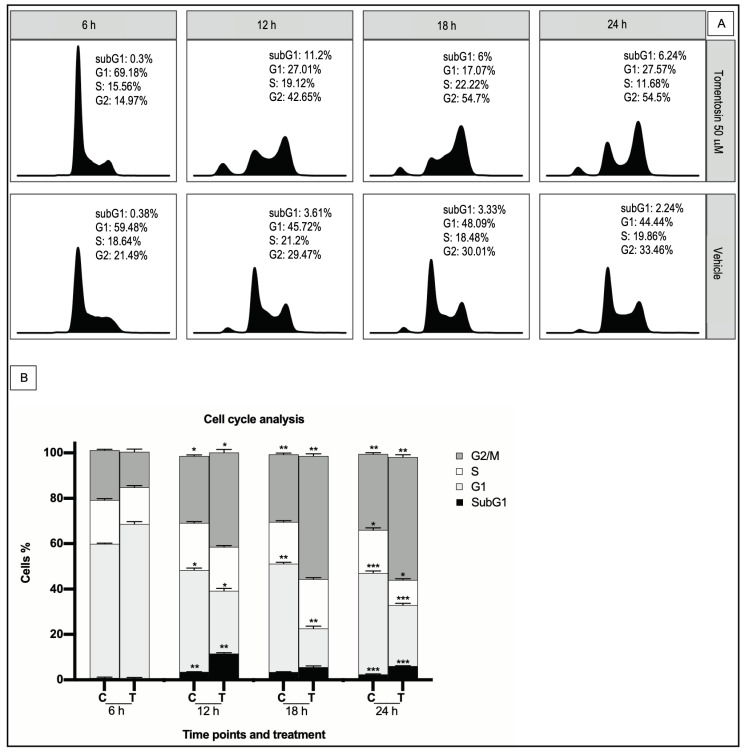
Figure 3.
Effects of tomentosin on cell cycle progression in the Raji cell line. (A) Histograms show cell cycle profiles of tomentosin-treated Raji cells. X axis and y axis correspond to DNA content and fraction of events, respectively. (B) Raji cells treated with tomentosin 50 µM or vehicle solution (DMSO 0.05%) for 6, 12, 18, and 24 h have been blocked in the G2/M phase. Two-way ANOVA and Tukey’s post hoc test were applied for the statistical analysis of the cell cycle. The bars represent the mean and the standard deviation of the percentage of three independent experiments. Tomentosin treated cells vs control non treated, * p ≤ 0.0431; ** p ≤ 0.0046 and *** p ≤ 0.0007.

