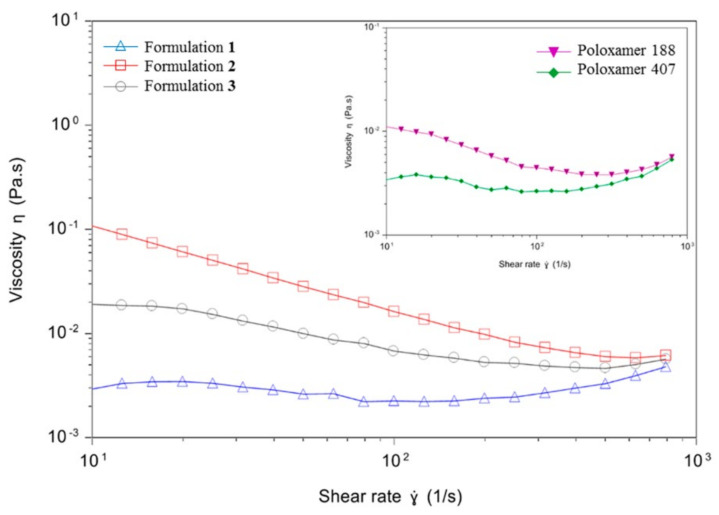
Figure 3.
Rheology measurements. Main graph: viscosity curves of niosomes based on formulations 1 (blue line, triangles), 2 (red line, squares) and 3 (grey line, dots) expressed as a function of shear rate. Secondary graph: viscosity curves of poloxamer 188 (violet line, inverted triangles) and poloxamer 407 (green line, rhombus) expressed as a function of shear rate.

