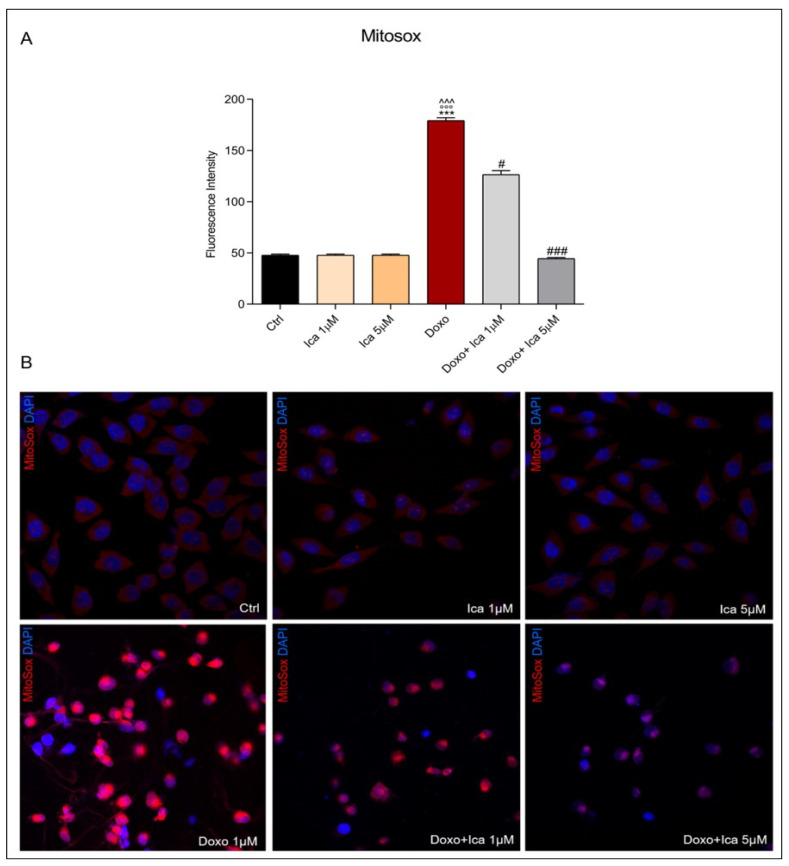
Figure 4.
The effect of Ica on mitochondrial superoxide overproduction. (A). Superoxide (O2−) levels were determined by immunofluorescence assay. Fluorescence was quantified using ImageJ® software by converting the intensity to a greyscale value based on the RGB colour model. For each treatment, 30–40 cells were processed. Significant differences in mean fluorescence were found between all treated cells. (B). Representative confocal images of H9c2 cells treated as described above. Red staining showed the MitoSOX fluorescent probe used to identify mitochondrial O2− overproduction, blue staining showed DAPI (4’,6-diamidino-2-phenylindole), used for nucleic acid staining. Cell images were collected using a 40× confocal microscope objective. Data are expressed as mean ± SEM., *** p < 0.001 vs. Ctrl; °°° p < 0.001 vs. Ica 1 μM; ^^^ p < 0.001 vs. Ica 5 μM; # p < 0.05 vs. Doxo; ### p < 0.001 vs. Doxo; Kruskal-Wallis test and Dunn’s multiple comparisons test (n= 3). Data is for three independent experiments.

