Figure 4.
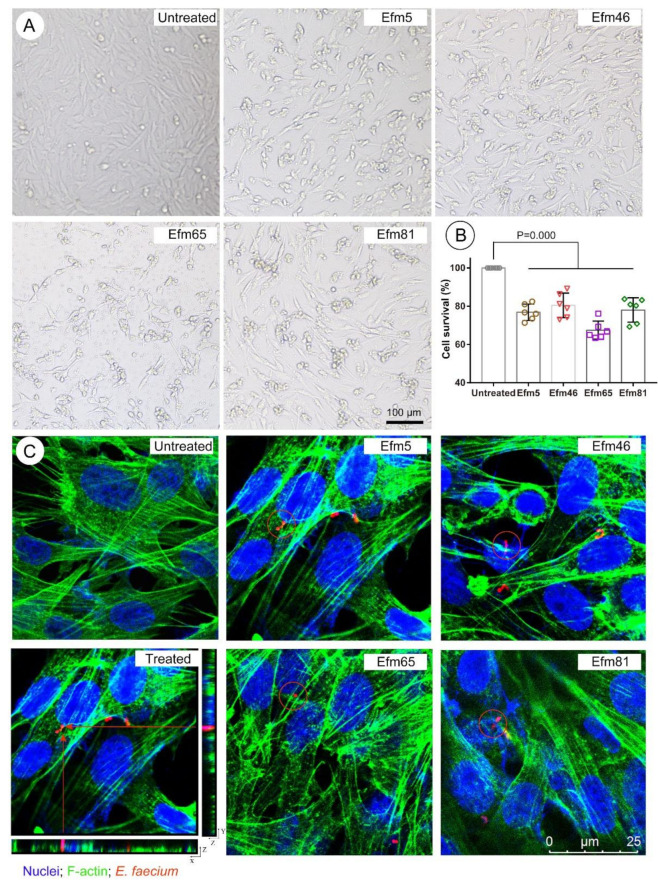
Toxicity evaluation of probiotic enterococcal isolates in vitro. (A) The morphology of human intestinal epithelial cells (HIEC cells) in different treated groups. Scale bar = 100 µm. (B) Rates of cell survival in different treated groups. (C) Probiotic enterococcal isolates internalization in human intestinal epithelial cells. F-actin was stained by GFP (green) and nuclei were counterstained with DAPI (blue). Enterococcal isolates were stained by rhodamine-phalloidin (red). Red arrows: Internalized bacteria in a 3D image. Red circles: Internalized bacteria. Scale bar = 25 µm. Differences in B were assessed by one-way ANOVA, and the values are presented as the mean ± SD. p ≤ 0.05 was considered to be significant.

