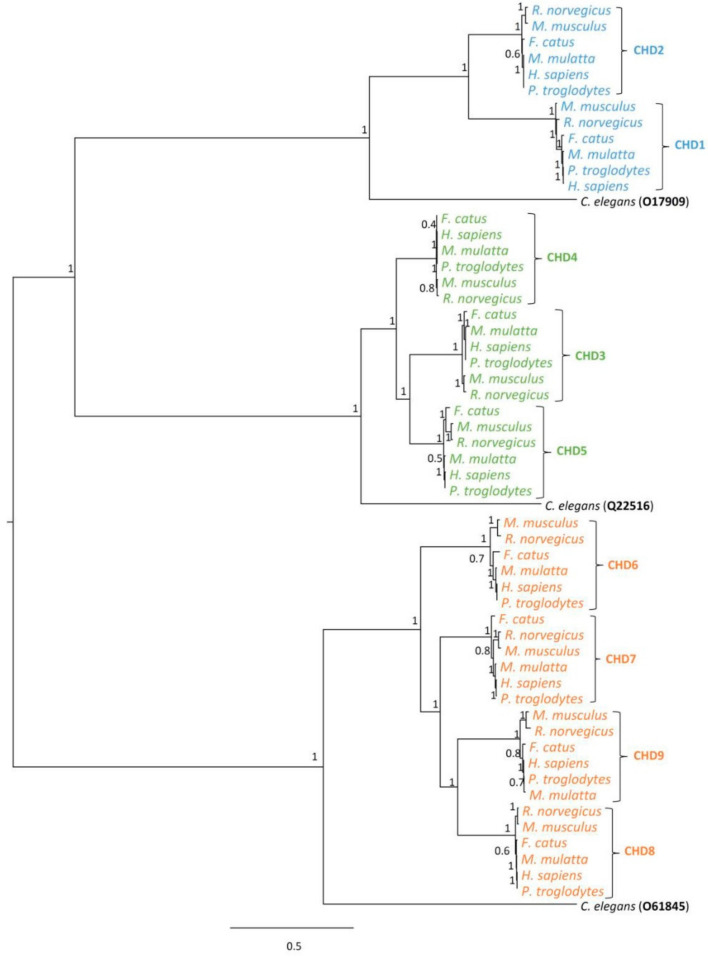
Figure 1.
Phylogenetic tree for the CHD family of proteins. Evolutionary model was determined automatically using the built it SMS [56] option in PhyML 3.0 [57] resulting in JTT+G+I. Branch support values shown at tree nodes correspond to posterior probabilities determined using aBayes [58]. The highlighting represents each protein group (blue: group I; green: group II and orange: group III).

