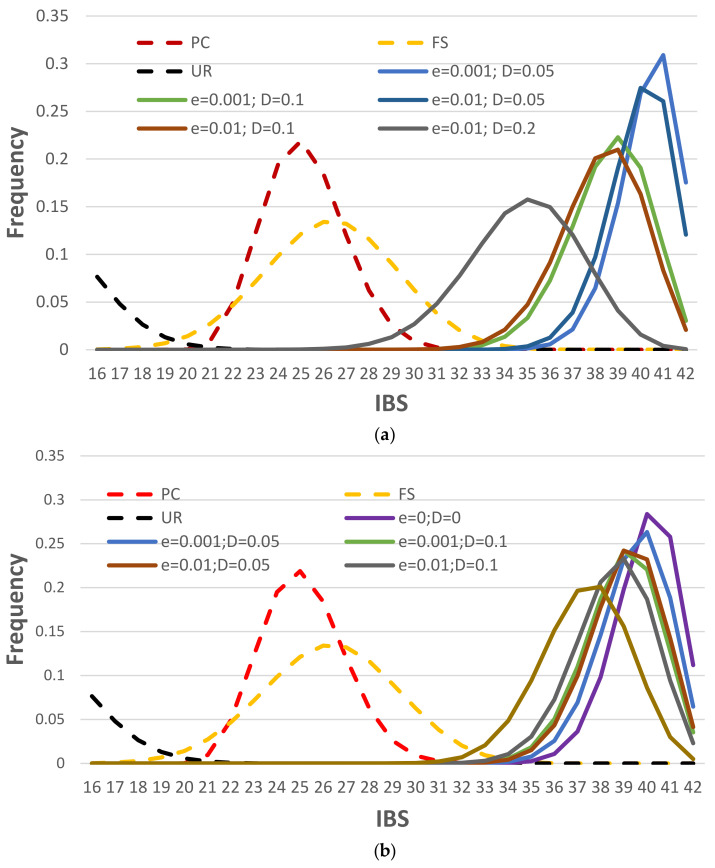
Figure 5.
IBS distributions of unrelated and related pairs (UR, PC, and FS, in dotted lines) and pairs of the true profile versus the consensus profile with a given number of cells (in solid lines) for (a) 1 diploid cell and (b) 4 haploid cells. 1,000,000 simulations for each distribution. Missing alleles are excluded in counting IBS.

