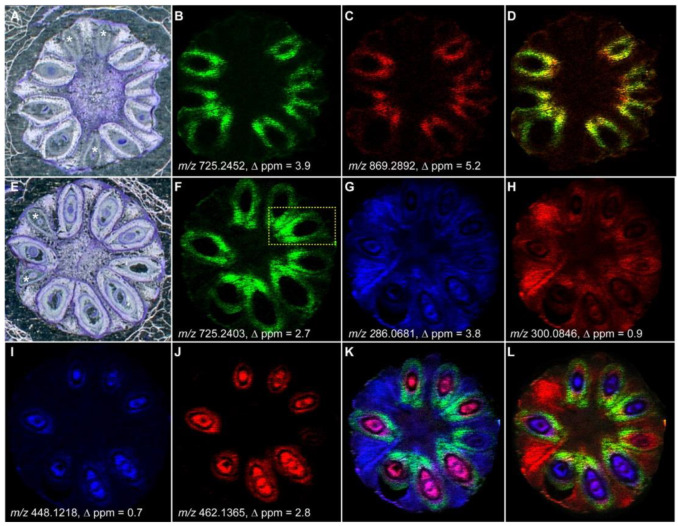
Figure 4.
MALDI MSI of the spatial distribution of flax lignans SDG and 6a-HMG SDG 6 days after flowering (DAF) and cyanogenic glucosides linamarin, lotaustralin, linustatin, and neolinustatin 7 DAF. (A) Optical image of the transversal section of a flax capsule 6 DAF; (B,C) MALDI MSI of SDG and 6a-HMG SDG 6 DAF, respectively; (D) merge picture of (B,C); (E) an optical image of the transversal section of a flax capsule 7 DAF; (F–J) MALDI MSI of SDG, linamarin, lotaustralin, linustatin, and neolinustatin, respectively; (K) merged picture of (F,G,I); (L) merged picture of (F,H,J); Images were generated using a 20 μm spatial resolution, scale: 5 mm [24].

