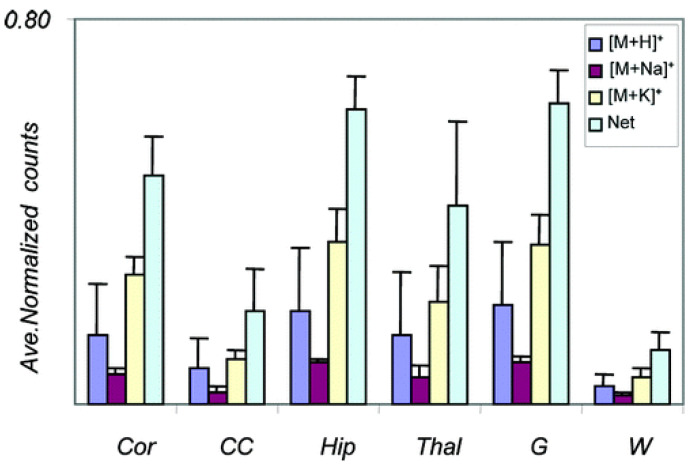
Figure 8.
Graphical display of the measured intensity of alkali salt adduct forms of PC (16:0/16:0) ([M + H]+, m/z 734.6; [M + Na]+, m/z 756.6; [M + K]+, m/z 772.6) and their sum averaged over four different MALDI MS images. Cor: cortex, CC: corpus callosum, Hip: hippocampus, Thal: thalamus, G: cerebellum gray, W: cerebellum white [92].

