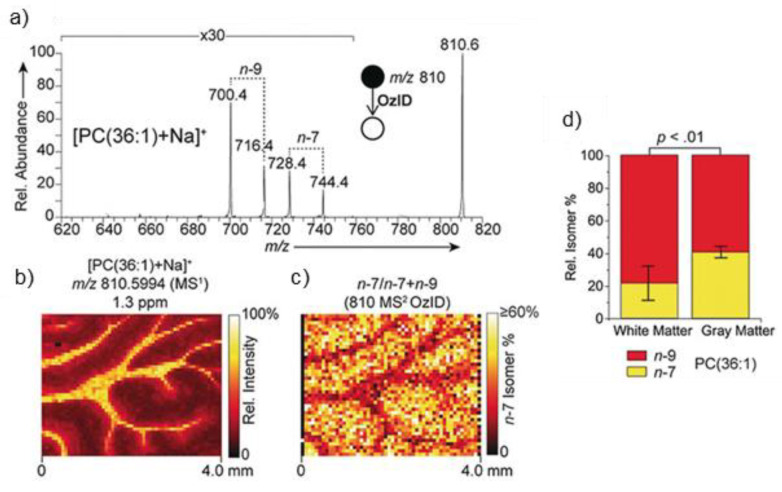
Figure 9.
(a) MALDI OzID spectrum of [PC (36:1) + Na]+ ions revealing the presence of n-9 and n-7 db isomers, (b) The corresponding full-scan FTMS image of the [PC (36:1) + Na]+ ion (m/z 810.5994) and (c) fractional distribution image of n-7 and n-9 isomers (n-7)/(n-7 + n-9) showing an enrichment of the n-7 isomer in the gray matter. (d) Graphs show the n-7 and n-9 relative isomer percentages for PC (36:1). Error bars represent the coefficient of variation from each region (n = 5 each for white and gray matter regions) [102].

