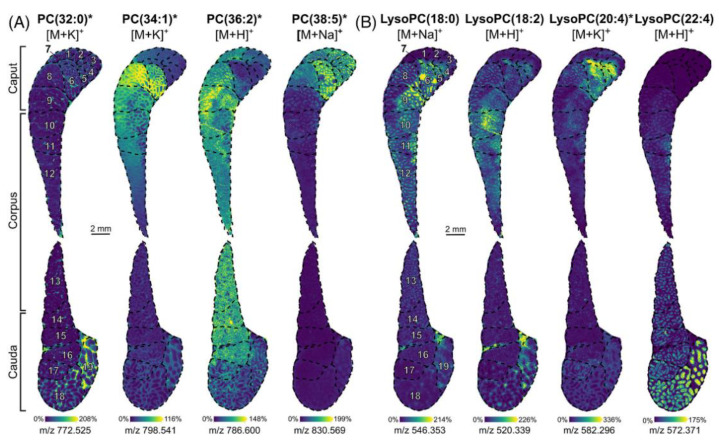
Figure 10.
MALDI MSI shows the in situ localization of several PC and LysoPC. Ion images of (A) PC (32:0) ([M + K]+, m/z 772.525), PC (34:1) ([M + K]+, m/z 798.541), PC (36:2) ([M + H]+, m/z 786.600), and PC (38:5) ([M + Na]+, m/z 830.569) and (B) LysoPC (18:0) ([M + Na]+, m/z 546.353), LysoPC (18:2) ([M + H]+, m/z 520.339), LysoPC (20:4) ([M + K]+, m/z 582.296), and LysoPC (22:4) ([M + H]+, m/z 572.371). Ions for which the annotation was confirmed by on-tissue CID are marked with an asterisk. Numbers indicated on the ion images correspond to the 19 intraregional segments. Ion images are presented in veridis color scale automatically adjusted with the hot spot removal option [108].

