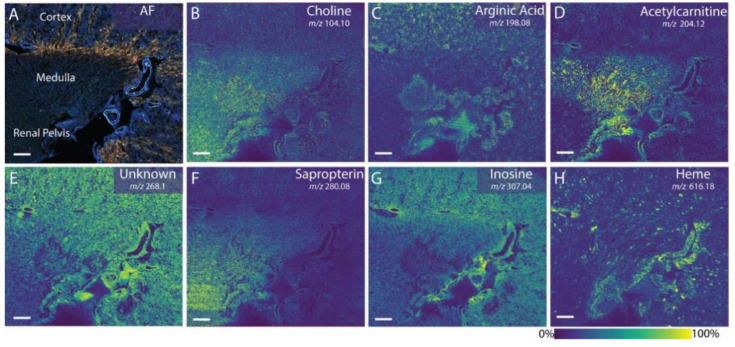
Figure 11.
Ion images of small metabolites at 20 μm pixel size correlated to autofluorescence (AF) microscopy (A), showing the spatial and size diversity of the detectable analytes (B–H). Each metabolite localizes to different regions within the kidney, such as the cortex, medulla, and renal pelvis. Scale bars are 1.5 mm [113].

