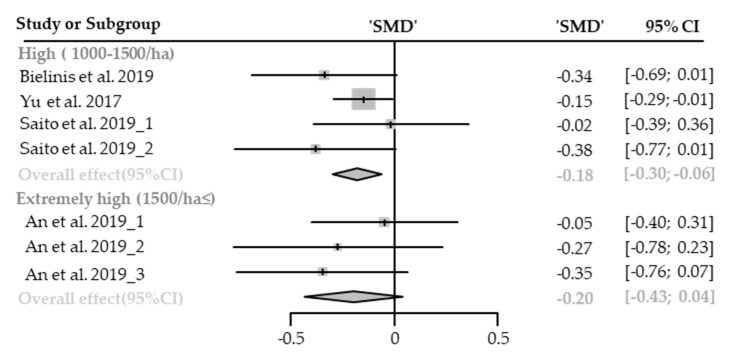
Figure 11.
Two forest plots of the change in DBP in subgroup analysis by stand density: high (1000–1500/ha), extremely high (1500/ha≤). The data are reported as standardized mean differences (SMD) and 95% confidence intervals (CIs). The diamond at the bottom presents the overall effect. The plotted squares denote SMD, and the whiskers denote their 95% CIs.

