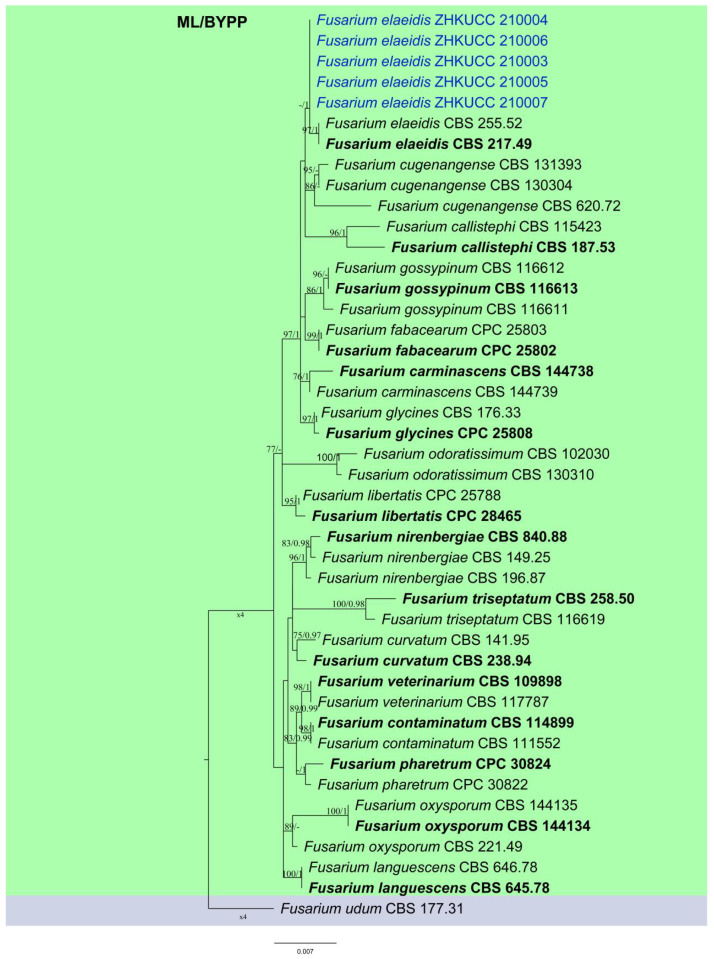
Figure 2.
Phylogenetic tree of the Fusarium based on maximum likelihood and MrBayes of rpb2, tef1 and tub2 gene sequences. The ML bootstrap support values above 75% and BYPP higher than 0.90 are shown as ML/BYPP at each node. Some branches were shortened to fit them to the page. Ex-type isolates are bold, the isolates in the study are marked in blue.

