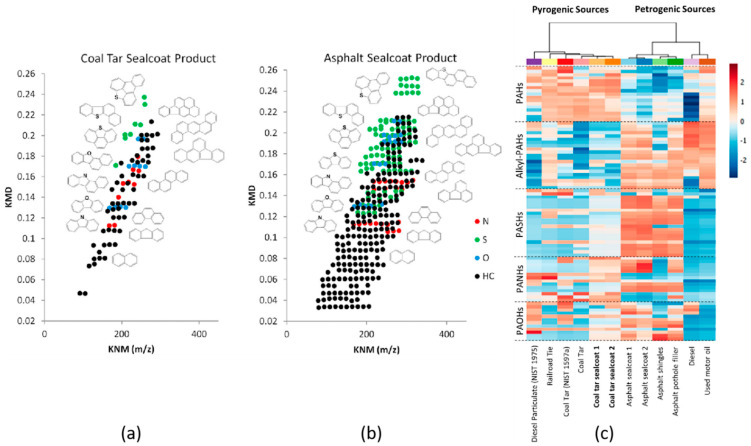
Figure 3.
Kendrick mass defect (KMD) plots of (a) a coal tar sealcoat product, and (b) an asphalt sealcoat product. (c) Two-dimensional hierarchical cluster analysis with heat map plot of various environmental PAH sources. The colors red and blue represent the most intense and least intense relative abundance values (log scale). The relative abundances in the heat map plot are presented as an average of three replicates. Reproduced from Bowman et al. [84] with permission. Copyright 2019 American Chemical Society.

