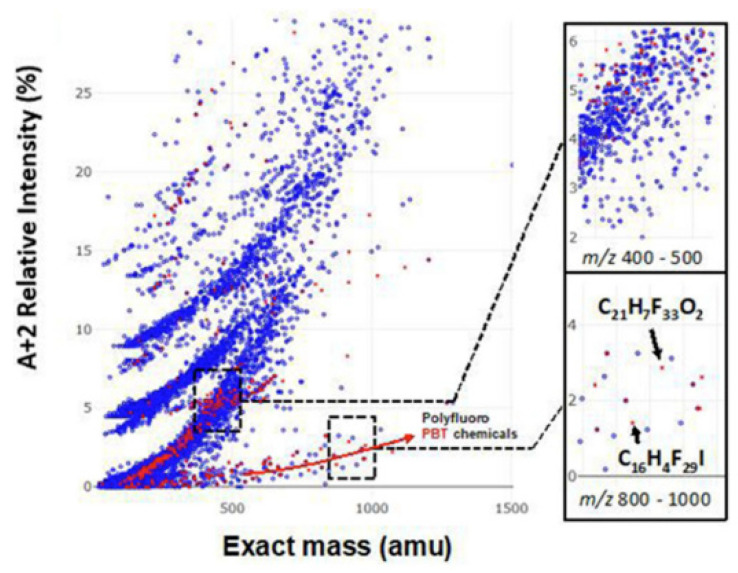
Figure 6.
Distribution of 610 prioritized persistent bioaccumulative compounds (in red) and commercial chemicals (in blue) from the North American chemical inventories in the compositional spaces defined by m/z of the molecular ion and the ratio of its isotopic peaks (A + 2): A, where “A” is the most intense isotopic peak. Adapted from Zhang et al. [41]. Copyright 2019, with permission from Elsevier.

