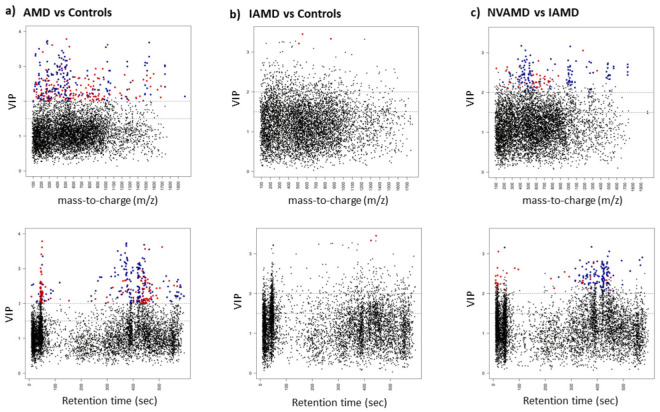
Figure 1.
Discriminatory features identified by PLS-DA and linear regression analyses. Manhattan plots displaying significant discriminatory features (PLS-DA VIP ≥ 2 and linear regression FDR < 0.1 (p < 0.05)) that were higher (blue dots) or lower (red dots) in the plasma of (a) AMD patients compared to controls, (b) IAMD patients compared to controls, and (c) NVAMD patients compared to IAMD patients. Black dots indicate features that did not meet significance criteria. There are two plots for each comparison—VIP by m/z and VIP by Retention time (sec). AMD: age-related macular degeneration; IAMD: intermediate AMD; NVAMD: neovascular AMD; PLS-DA: partial least-squares discriminant analysis; VIP: variable importance for projection.

