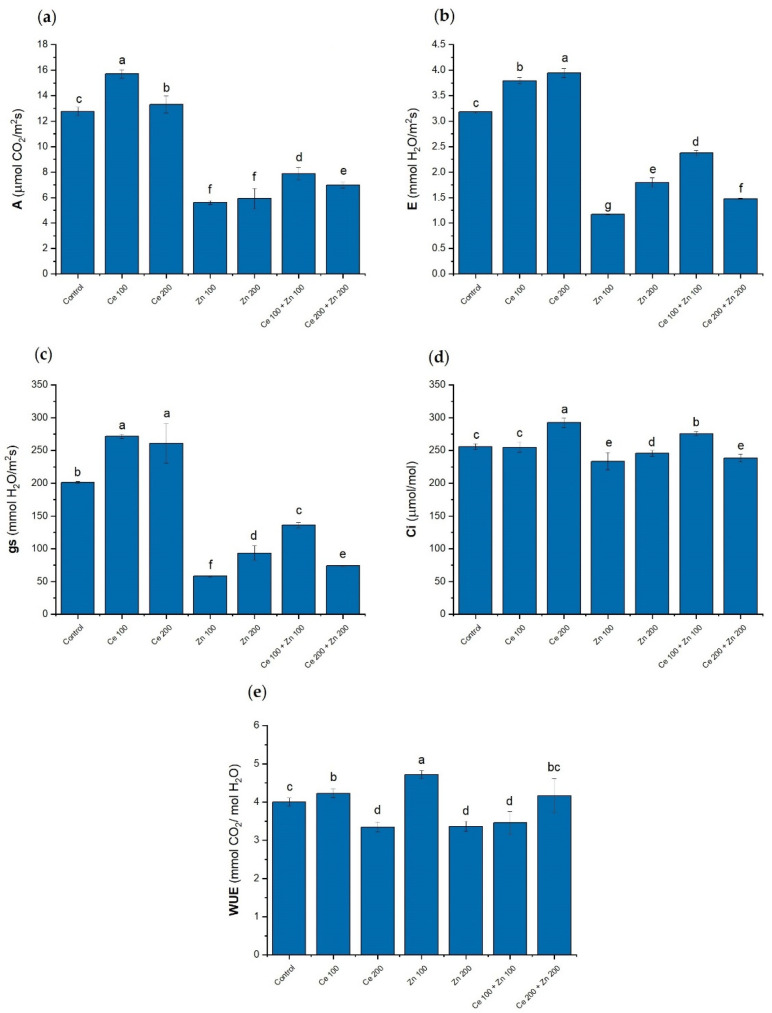
Figure 4.
Leaf net photosynthesis A (a), transpiration E (b), stomatal conductance gs (c), sub-stomatal CO2 concentration Ci (d), and water use efficiency (WUE) (e) for Pisum sativum L. grown under the sole or combined CeO2 and ZnO NPs treatments. Concentrations of nanoparticles are given in mg/L of elemental cerium or zinc, respectively. The cultivation time was 12 days. Vertical bars represent standard deviations (n = 6). Distinct letters show the statistically significant differences among treatments as calculated with Tukey’s HSD post hoc test (p = 0.95).

