Figure 5.

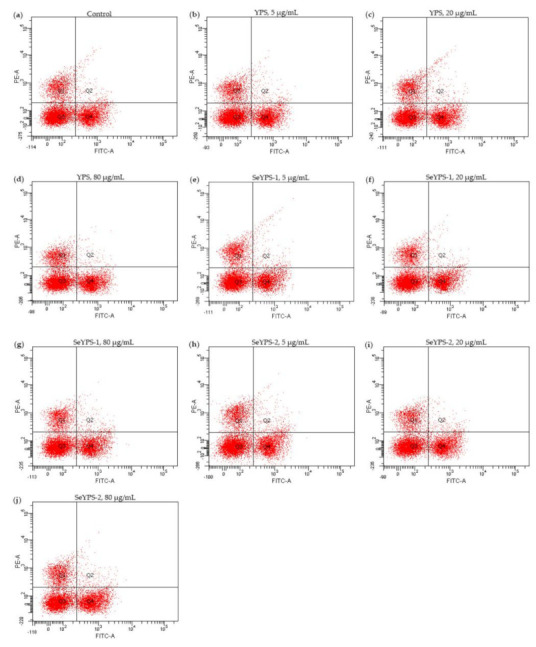
The analyzed results for T-lymphocyte subpopulations by flow cytometry for the control splenocytes (a), or those treated by YPS (b–d), SeYPS-1 (e–g), and SeYPS-2 (h–j) at different dosages.

The analyzed results for T-lymphocyte subpopulations by flow cytometry for the control splenocytes (a), or those treated by YPS (b–d), SeYPS-1 (e–g), and SeYPS-2 (h–j) at different dosages.