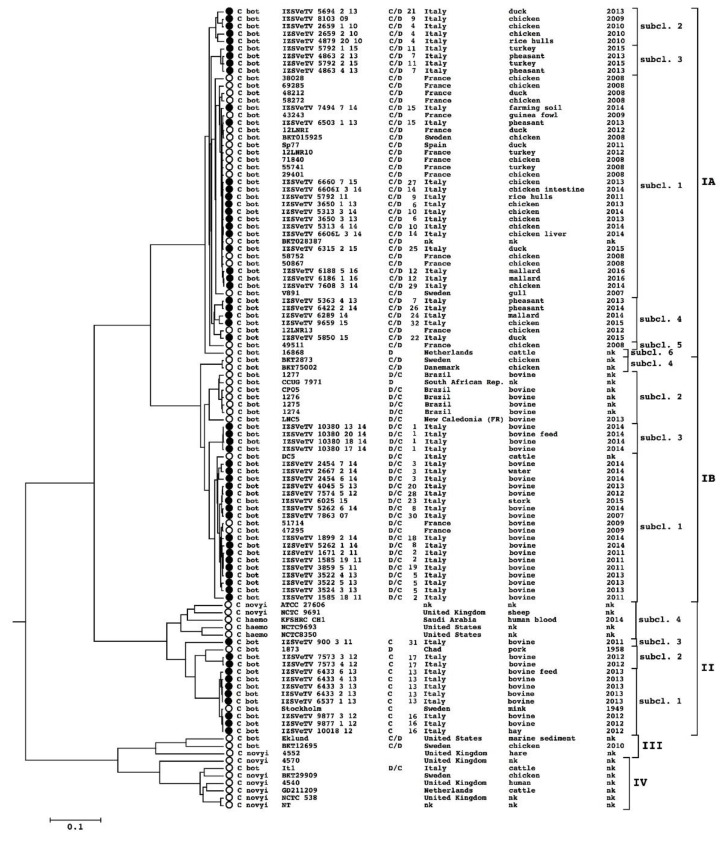
Figure 1.
Dendrogram representing the phylogenetic relations among the analyzed strains, as calculated using Gegenees software. The new sequenced genomes are marked with black dots while the genomes already analyzed in previous studies are marked with white dots. For each sample, the information shown in the Figure are, from left to right: species, sample name, serotype, outbreak ID, geographical origin, isolation source, isolation year.

