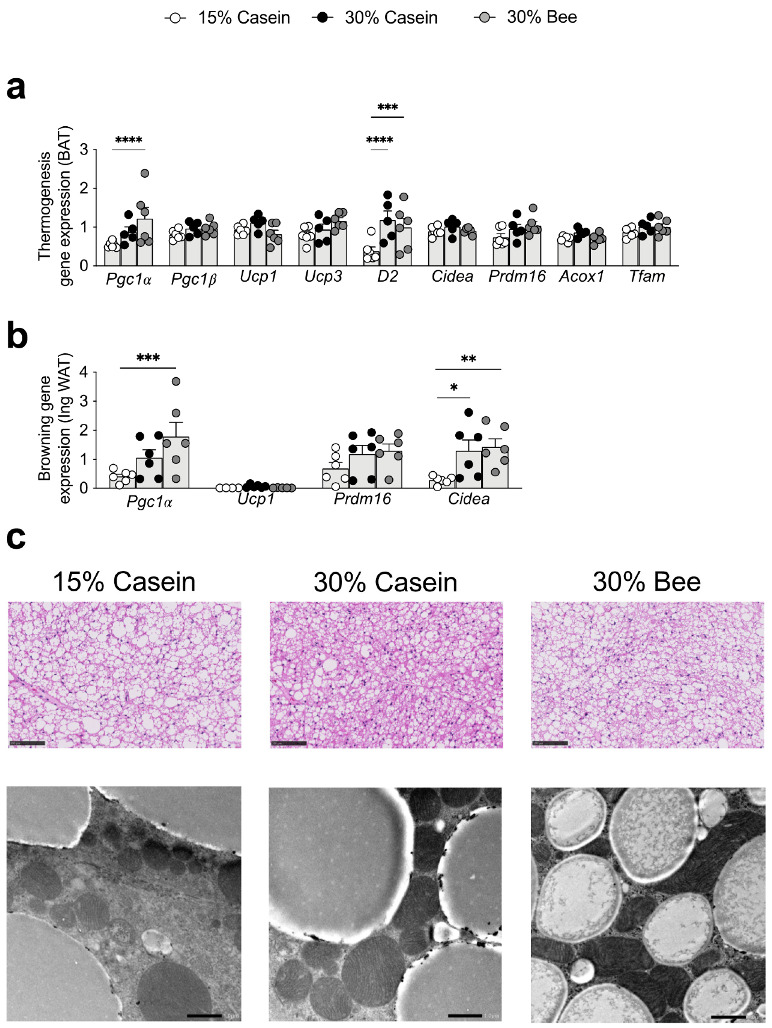
Figure 6.

Effects of bee larva protein on lipid metabolism. (a–c), Analysis of the mice used in Figure 1. (a) Relative mRNA expression levels involved in thermogenesis in brown adipose tissue (BAT). (b) Relative mRNA expression levels involved in thermogenesis inguinal white adipose tissue (ingWAT). (c) Representative images of BAT stained with H&E. Magnification bar, 100 μm. Representative image of transmission electron microscopy analysis of BAT. Scale bar, 1 μm. Data are mean ± s.e.m. * p ≤ 0.05, ** p ≤ 0.01, *** p ≤ 0.001, **** p ≤ 0.0001. p values were calculated using ANOVA and post hoc tests.
