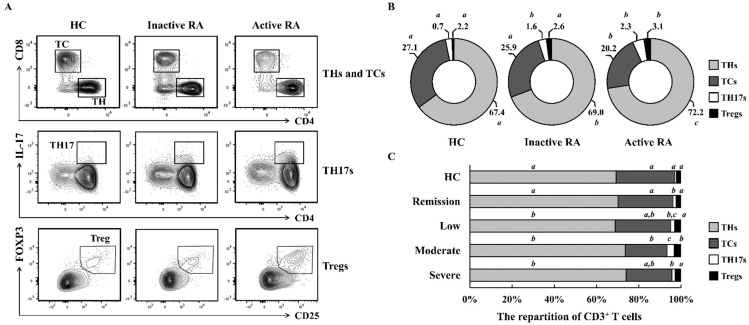
Figure 1.
Repartition of T cell subsets in PBMCs according RA disease activity. (A,B) PBMCs were isolated from active RA (n = 20), inactive RA (n = 20), and healthy controls (n = 10; Table 1). Cells were analyzed with specific markers as described in the Supplementary Data S1. Data represent results of one median experiment in panel A and the averages of T cell subpopulations were displayed in panel B. Different letters (a, b, c) in panel B correspond to statistical differences of each T cell subsets among healthy control, Inactive RA, and Active RA groups (p < 0.05), as determined by One-way ANOVA with S-N-K’s post hoc test for multiple comparisons. (C) For a more detailed classification, patients in panels B were separated into four groups based on RA activity. The distribution of T cell subsets was analyzed using flow cytometry (n = 10 per group; Table 1). Statistical analysis among human subject groups was performed by one-way ANOVA, followed by Duncan’s post hoc test. Different letters (a, b, c) indicate statistically significant differences of each T cell subsets among healthy control, patients in the remission, low, moderate, and severe RA groups (p < 0.05).

