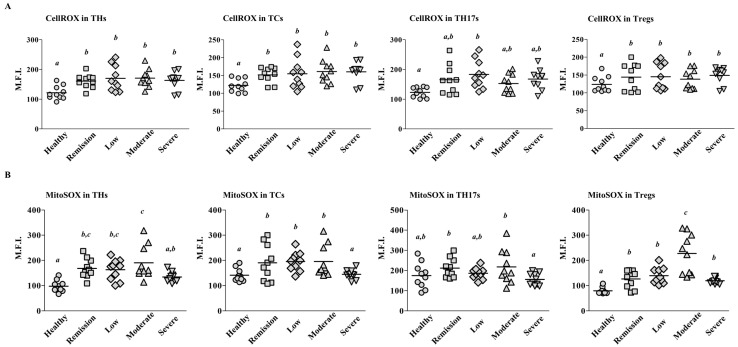
Figure 2.
ROS expression among T cell subsets. PBMCs were isolated from patients with Severe, Moderate, Low, and Remission RA and healthy controls (n = 10 per group; Table 1). The expression levels of CellROX (A) or MitoSOX (B) in each T cell subset were measured using flow cytometry. Data are shown as the mean fluorescence intensity (M.F.I.). Each symbol represents an individual donor. The bar represents the mean. Statistical analysis among human subject groups was performed by one-way ANOVA, followed by Duncan’s post hoc test. Different letters (a, b, c) indicate statistically significant differences of ROS expressions among healthy control, patients in the remission, low, moderate, and severe RA groups (p < 0.05).

