
Fig. 3.
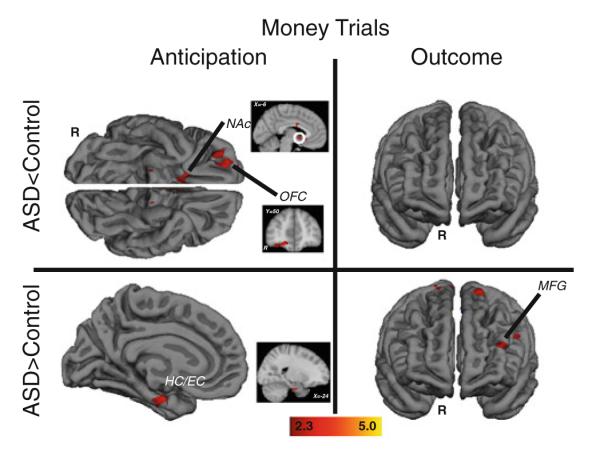
Brain areas showing significant group differences in response to monetary incentives. Anticipatory responses are on the left and outcome responses are on the right; clusters with relatively less activation in the ASD group are in the top panels, clusters with relatively greater activation in the ASD group are in the bottom panels. Outcome panels depict the anterior view of the brain. OFC orbital frontal cortex, NAc nucleus accumbens, HC/EC hippocampus/entorhinal cortex, MFG midfrontal gyrus