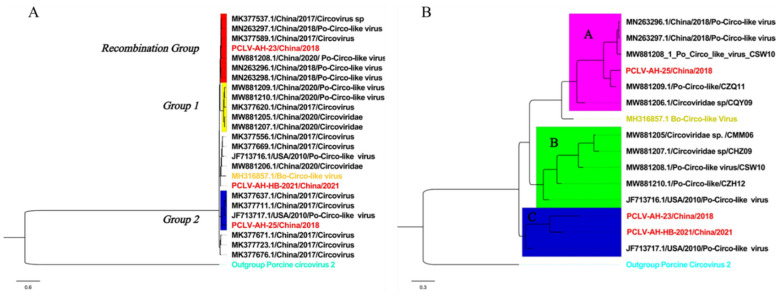
Figure 4.
Phylogenetic analysis based on complete sequences and Rep. Strains from this study are marked in red. (A) Rep: The best substitution model was TIM2 + F + G4. Branches marked in yellow are those with recombination events, and Mutation Groups 1 and 2 are strains with mutations. (B) Complete sequences: The best substitution model was TPM3 + F + G4. The tree is divided into three branches, each underlined with a different color.

