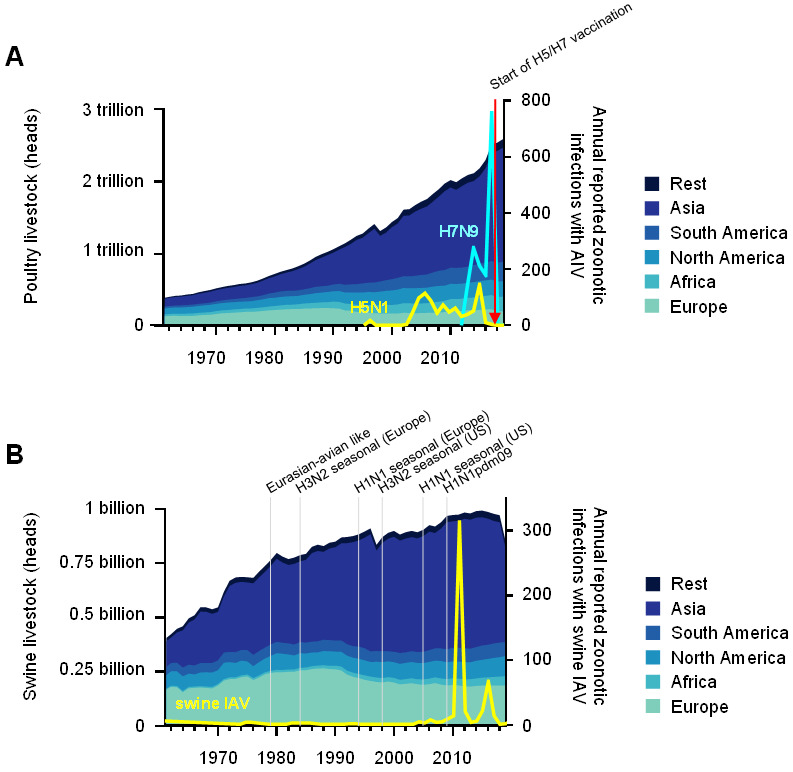
Figure 1.

Poultry and swine livestock increased worldwide since 1961, as well as zoonotic transmission events and the establishment of IAV lineages. (A) The amount of poultry that were produced per year is shown for different global regions as share of the worldwide production on the left y-axis. The right y-axis indicates the number of humans that were infected with AIVs (H5N1 cases in yellow, H7N9 cases in light blue). The red arrow indicates the start of the H5/H7 poultry vaccination campaign. (B) On the left y-axis, the amount of swine livestock in different global regions as share of the worldwide production per year is shown. The number of humans that were infected with swine IAV are shown on the right y-axis (yellow line). The establishment of major IAV lineages in swine is indicated. The data on livestock were retrieved from FAOSTAT.
