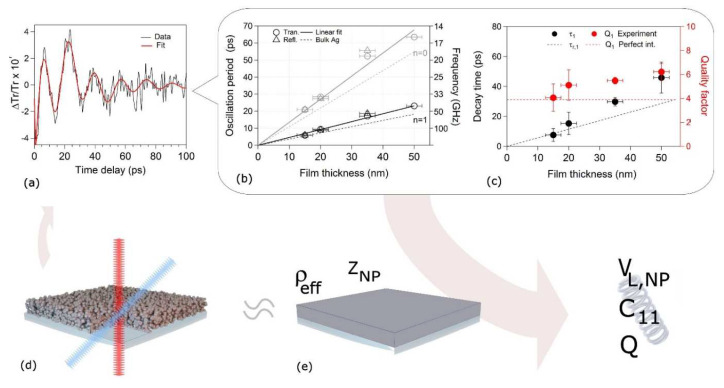
Figure 8.
(a) Relative transmission variation vs. delay time acquired on a 35 nm thick NP film. Data (black line) and its fit are based on two damped oscillators (red line). (b) Oscillation period (left axis) and frequency (right axis) vs. film thickness obtained from transmission (circle) and reflection (triangle) geometry. Fundamental (n = 0) breathing mode data are in gray and first harmonic (n = 1) are in black. Full lines: linear fit through the origin of the data. Dashed lines: fundamental (n = 0) and first harmonic (n = 1) breathing mode period calculated from Equation (4), assuming bulk Ag values for the thin film. (c) Attenuation time (black, left axis) and quality factor (red, right axis) for the n = 1 breathing mode vs. film thickness. Markers: experimental data. Dashed line: theoretical values calculated from Equation (5) adopting the perfect interface model between the sapphire substrate and a homogeneous film with the same density and longitudinal sound velocity as those experimentally obtained for the Ag NP films, as exemplified in the scheme of panel (e). Adapted from ref. [37]; further permission related to the material excerpted should be directed to the ACS. (d) Scheme of the Ag NP film deposited on sapphire, evidencing the pump (blue) and probe (red) laser beams.

