Figure 3.
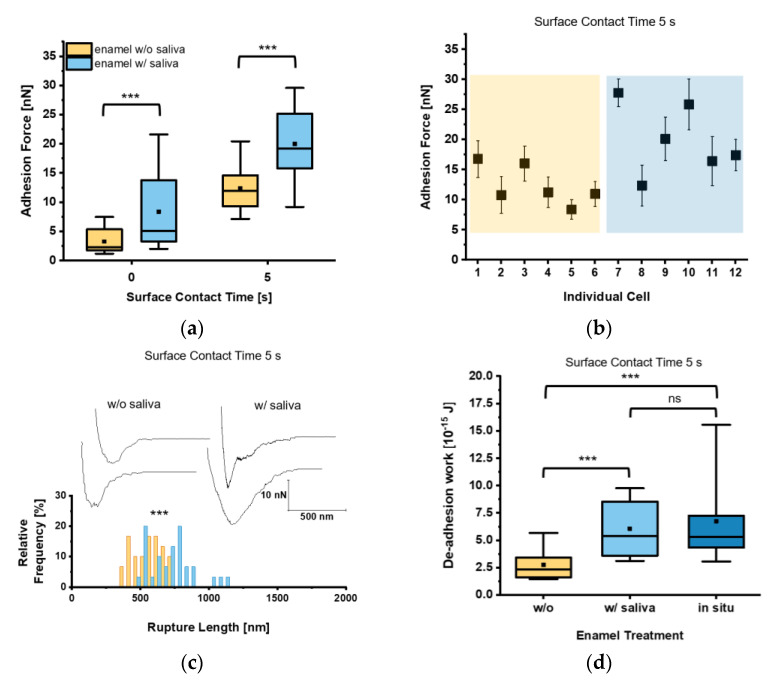
Adhesion of untreated Candida albicans yeast cells to tooth enamel and the impact of salivary pellicle. (a) Adhesion forces of C. albicans yeast cells to untreated or saliva-treated enamel and for surface contact time delays of 0 s and 5 s. Data are presented in box and whisker plots (min-to-max), with median (horizontal line) and mean value (closed square). For each box 30 data points of six individual cells with five data points per cell are depicted. ***, p < 0.001 (Mann-Whitney U Test). (b) Adhesion forces of individual yeast cells. Shaded areas indicate treatment of the enamel w/o (orange) or w/(blue) saliva. Mean adhesion forces and standard deviations are indicated. (c) Representative retraction curves for untreated (left) and saliva-treated (right) enamel and rupture lengths for a surface contact time delay of 5 s. The histogram for rupture lengths consists of a bin size equivalent to 50 nm. ***, p < 0.001 (Mann-Whitney U Test). (d) De-adhesion work of yeast cells for a contact time of 5 s for untreated, saliva-treated, and in situ-exposed tooth enamel. Data are presented in box and whisker plots (min-to-max), with median (horizontal line) and average (closed square). For each box 30 data points of six individual cells with five data points per cell are depicted. ns, not significant; ***, p < 0.001 (Kruskal-Wallis test followed by post-hoc analysis).

