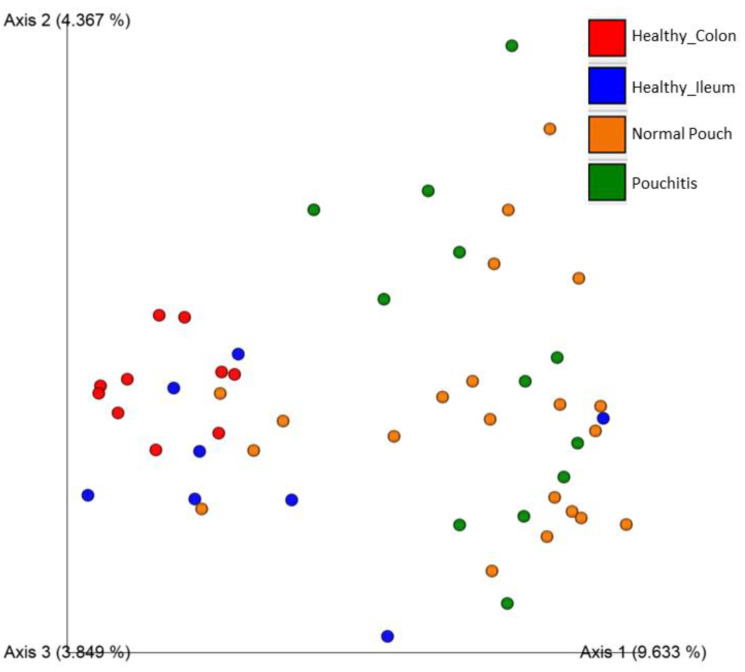
Figure 3.
Principal Coordinates Analysis Plot for Healthy Colon (red), Healthy Ileum (blue), Normal Pouch (yellow), and Pouchitis (green) sample groups; distances across samples are calculated through Jaccard Index. More details are in Supplementary File S1.

