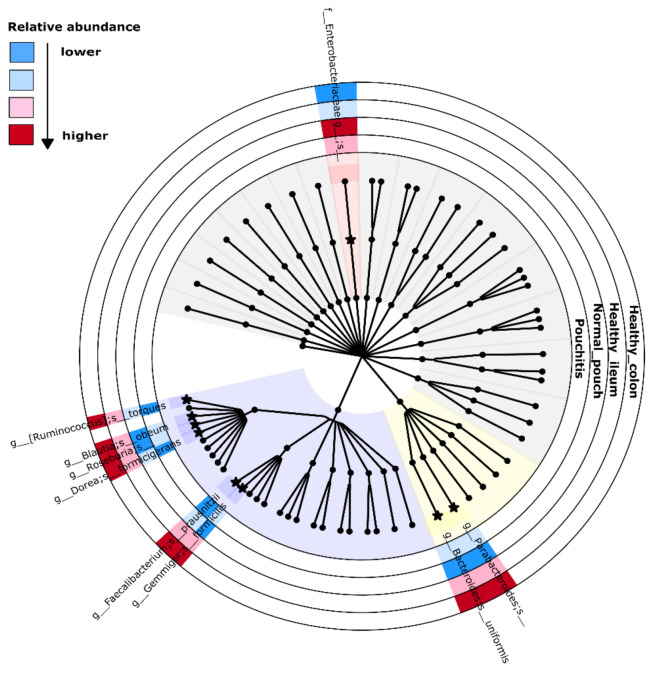
Figure 4.
Cladogram for ANCOM significant results. Concentric circles represent the four investigated groups. Cladogram has been generated by implementing Graphlan Package on the genus-collapsed taxonomy by QIIME2. Internal nodes: order and family; leaves: genus. Background colors: violet for Clostridiales, yellow for Bacteroidales, red for Enterobacteriales, and grey for remaining groups. Starred nodes and colored sections are relative to ANCOM-relevant taxa: extended taxonomic name is adjacent to nodes, while color interpretation is shown in the top-left part.

