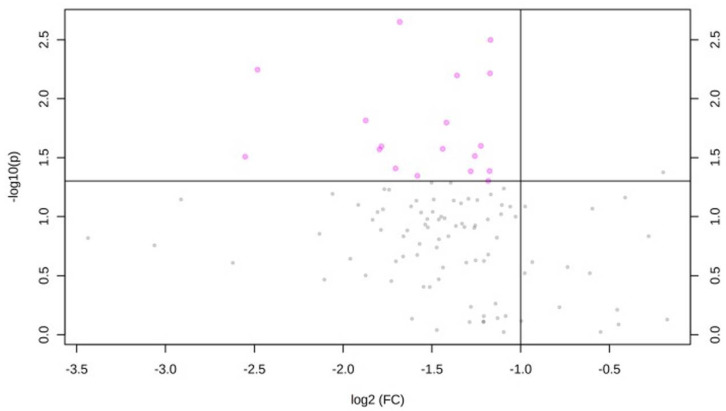
Figure 2.
Comparison of lipid species across categories of diet. Volcano plot of important lipid features identified by the comparison between poor and intermediate dietary categories. This plot shows the magnitude (log 2 Fold-change of intermediate versus poor category; x-axis) and significance (−log 10 p-value; y-axis) for the comparison of lipids between intermediate and poor scores of dietary CVH metric. Lipid species with fold-change >2 or <0.5 and p-value < 0.05 are represented as pink dots.

